See which client work grows the business and which drains it.
Professional services firms (consultancies, agencies, law firms, accounting practices) run on utilization, project-based revenue, and contractor costs. Your revenue is lumpy, your costs are people-heavy, and your cash flow depends on client payment timing. RunwayCal tracks project-based deals, team costs, and cash collection so you know your position after every invoice.
- Multi-client visibility
- Project revenue tracking
- Board-ready exports
- From $29/mo
Service businesses operate on delayed financial feedback.
Revenue depends on client payment timing
You completed the project in March. The invoice went out in April. The client paid in June. Your bank balance in April does not reflect the $50K you are owed. RunwayCal tracks deals with payment status (committed vs received) and shows the gap between recognized revenue and collected cash.
Team costs are your entire burn
In professional services, 85-95% of your costs are people. Full-time employees, contractors, and freelancers. A single senior hire changes your monthly burn significantly. RunwayCal shows payroll by department, contractor costs as cash commitments, and the combined impact on runway.
Project pipeline is not guaranteed revenue
A signed Statement of Work is committed revenue. A verbal agreement is pipeline. A warm introduction is wishful thinking. RunwayCal lets you track deals at different stages and shows runway based only on confirmed (Won) deals. Pipeline deals can be modeled as scenarios without inflating your baseline numbers.
Cash timing gap
Payroll Paid
Day 1
Project Delivered
Day 30
Cash out phase
Invoice Sent
Day 45
Cash in phase
Payment Received
Day 75-90
Payroll Paid
Day 1
Project Delivered
Day 30
Invoice Sent
Day 45
Payment Received
Day 75-90
Financial tools built for project-based revenue.
Project-based deal tracking
Each client engagement is a deal with amount, type (recurring retainer or one-time project), status, and payment schedule. Track receipts against each deal to see collection progress. Overdue payments surface in the Pending Collections alert on Mission Control.
Contractor and team cost management
Full-time team members tracked with salaries. Contractors tracked as cash commitments with monthly amounts and contract end dates. The combined team cost feeds into burn rate, runway calculation, and budget variance. See the full cost of your delivery team, not just payroll.
Utilization and revenue per head
Revenue per employee tells you whether your team is generating enough to cover their cost. Track this metric over time in the Burn Efficiency section. If revenue per head is declining while headcount is growing, you are scaling the team faster than the work. RunwayCal surfaces this trend automatically.
Built for project-based financial operations.
Project Pipeline Visibility
Track committed revenue, invoice timing, collections, and delayed payments per client engagement. See which projects contribute to runway and which consume it.
Team Cost Modeling
See how hiring decisions, utilization changes, and payroll growth affect burn rate and runway. Model adding 3 consultants before extending offers.
Multi-Client Operations
For fractional CFOs and agencies managing multiple clients: each client can be a separate instance on the Growth plan. Up to 7 independent dashboards.
Cash Exposure Tracking
Understand your True Cash Position after deferred revenue from project advances, upcoming tax obligations, and committed payroll. The cash you can actually deploy.
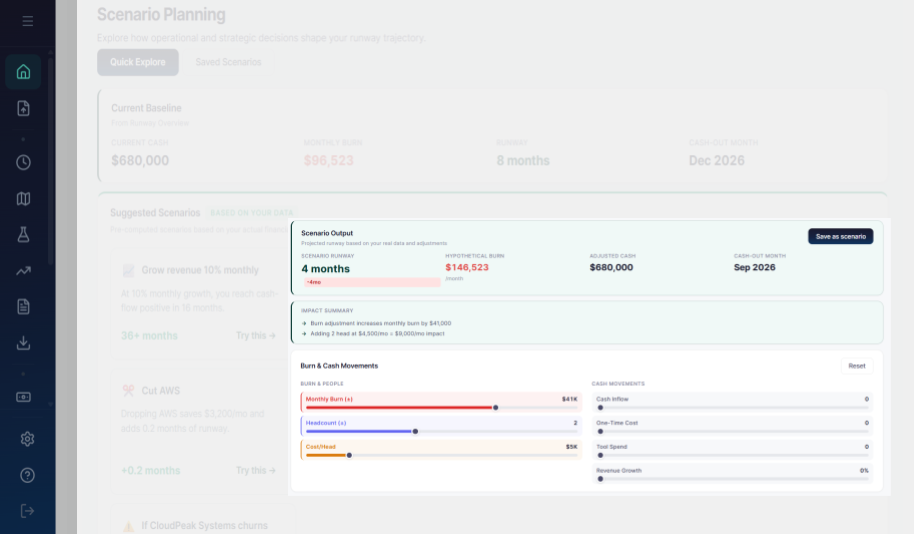
Model operational decisions before committing.
Overlay each scenario on your actual cash trajectory. See the runway impact in seconds. Deterministic outputs from inputs you define, not AI predictions.
Client-ready and board-ready reporting.
Executive Summaries
Auto-generated financial narratives for stakeholders. What is going well, what is concerning, where help is needed.
Board Viewer
Share a read-only financial snapshot via secure link. No account required for viewers. 30-day TTL.
PDF/PPTX Exports
Export branded financial reports for client presentations or board meetings with one click.
Metrics professional services firms actually care about.
Utilization Rate
Billable hours as percentage of total capacity
Client Concentration
Revenue share of top client relative to total
Revenue per Employee
Monthly recurring revenue divided by headcount
Collections Lag
Average days between invoice and payment receipt
Payroll % of Burn
Payroll as percentage of total monthly burn
Project Margin
Revenue minus direct costs per engagement
Financial operations should scale with your client base.
Free to start. No credit card required.